Bolyston Street @ Bowker Overpass
By: Samantha Kendrick
 |
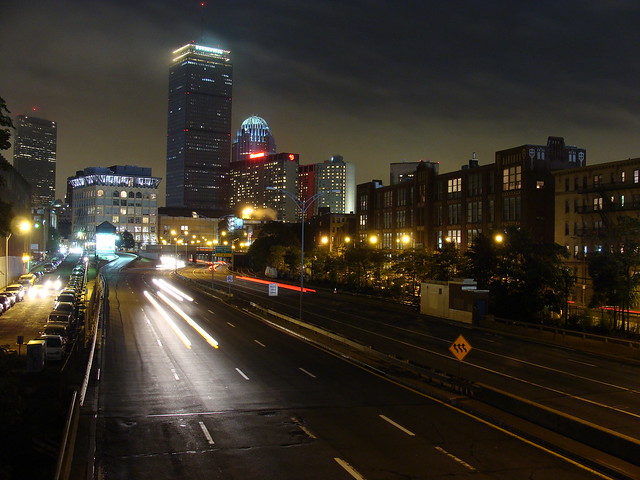
| The Bowker Overpass over the Massachusetts Turnpike |
Overview
Within metropolitan areas, in this example Boston, streets serve a wide spectrum of users and therefore must fulfill a wide range of functions. The spectrum of users, including motor traffic, pedestrians, and bicyclist must be accommodated to the best of the designers ability. In many cases, motor vehicles have overwhelming influence on street design with pedestrians and bicyclist nearing a close second. As the motorist are fully accommodated, pedestrians are left with a lower Level of Service (LOS) which can in fact affect the compliance of pedestrians and negatively impact pedestrian safety. A prime example of this scenario is at the Bowker Overpass @ Bolyston Street in Boston, Massachusetts. The Bowker Overpass is unique in that during it's peak hour factor, it must accommodate a high volume of pedestrians and motorist at the same time with a slight lack in priority on the pedestrians. It is our job to increase pedestrian safety which is directly correlated to pedestrian compliance and the LOS.
Link to Bowker Overpass Bowker Overpass Google Maps
History of the Bowker Overpass
The Bowker Overpass is unique in that it is multipurpose and serves a large volume of pedestrians and motorist, although there is not necessarily a balance on which user is more important. The Bowker Overpass is a steel beam bridge with a suspended deck supporting Charlesgate Street over Commonwealth Avenue, Beacon Street,and Interstate 90. For the purpose of this study, we will focus on the Bowker Overpass at Bolyston Street where the roadways lead off to the neighborhood of Kenmore, residential areas, local business shops, places of entertainment, schools, and even an Interstate highway. The Bowker Overpass has a history of being dysfunctional in regards to traffic control and most importantly in this case, pedestrian compliance. Opened in 1965, there are many talks about reconstruction or tearing down the overpass completely. We will investigate how there is a functionality problem in pedestrian compliance.
Problem at Hand
In this study we will investigate the lack of pedestrian compliance stemming from a long waiting time. I conducted a field study at a reasonable peak hour volume where traffic is at its heaviest with a high volume of pedestrians. The field study was conducted on a weekday in April at 6:30pm where the corresponding temperatures were high 57 degrees with a low of 46 degrees. Since the Bowker Overpass is known for its long waiting time for pedestrians, data was recorded in regards to the cycle length of two intersections and two corresponding crosswalks. The apparent wait time, pedestrian delay and Level of Service were all calculated to gauge the noncompliance of pedestrians. Ultimately we will discover that the longer the waiting time, the more likely pedestrians are to cross when they feel safe, not necessarily when it is actually safe.
Observations were taken at two intersections with corresponding crosswalks. We will first focus on Crosswalk A:
Observations at Crosswalk A
*Three trials were taken to increase the accuracy of results
Start of 'W'= Start of Walk signal for crosswalk
Start of 'FDW' = Start of Flashing Don't Walk for crosswalk (ped clearance)
Start of 'DW' = Start of Don't Walk for crosswalk
'r' = Red time for crosswalk = Cycle Length- 'W'
d = Average delay for pedestrians = (r^2/2*Cycle Length)
Apparent Excess time = Start of green - Start of 'DW'
*Apparent Excess time is the time pedestrians see the don't walk signal, although the green light for vehicles has not stared. Therefore this is their relative wait time for pedestrians.
Interpretation of Results
There are two important values to take note of that greatly influence the level of compliance of pedestrians, the Apparent Excess time (wait time), and the Level of Service (LOS) The Apparent Excess time is the time that pedestrians are given the don't walk signal, in yet the corresponding traffic has not started. In a pedestrians eyes, this can be very frustrating and they will most likely cross when they feel it is safe. Hence, the compliance is very low. Next when we look at the LOS, we note that for each of the trials, the LOS for pedestrians is E, which means that the likely hood of pedestrian compliance is high.
If we look at the chart below provided from the Highway Capacity Manual, the LOS is directly correlated to the average delay for pedestrians. Clearly having a LOS of E influences a high likelihood of noncompliance, which can give pedestrians a false sense of security when crossing which can be very dangerous.
The video above shows the noncompliance of two pedestrians crossing when the crosswalk signal is clearly red. They miss the traffic by a few split seconds. In this scenario, noncompliance can be dangerous when pedestrians have a false sense of security.
Conclusion
In metropolitan areas where streets that are multipurpose and empty out into residential areas just as much as it does into highways find a difficult time accommodating to the wide spectrum of users. Motorist have an overwhelming influence on the division of priority although pedestrians deserve a high priority as well. Pedestrian safety is significant in these areas because of the high volume of cars with high speeds. Having a low Level of Service influences a low level of compliance, which can in fact be very dangerous. The Bowker Overpass has a very long waiting time for pedestrians making pedestrian compliance very unlikely in most cases. Further provision must be taken to increase pedestrian compliance.
 |
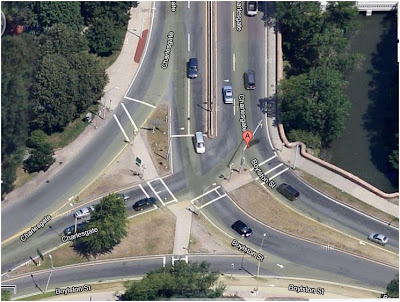
| Birds eye view of Bowker Overpass @ Bolyston |
Link to Bowker Overpass Bowker Overpass Google Maps
History of the Bowker Overpass
The Bowker Overpass is unique in that it is multipurpose and serves a large volume of pedestrians and motorist, although there is not necessarily a balance on which user is more important. The Bowker Overpass is a steel beam bridge with a suspended deck supporting Charlesgate Street over Commonwealth Avenue, Beacon Street,and Interstate 90. For the purpose of this study, we will focus on the Bowker Overpass at Bolyston Street where the roadways lead off to the neighborhood of Kenmore, residential areas, local business shops, places of entertainment, schools, and even an Interstate highway. The Bowker Overpass has a history of being dysfunctional in regards to traffic control and most importantly in this case, pedestrian compliance. Opened in 1965, there are many talks about reconstruction or tearing down the overpass completely. We will investigate how there is a functionality problem in pedestrian compliance.
 |
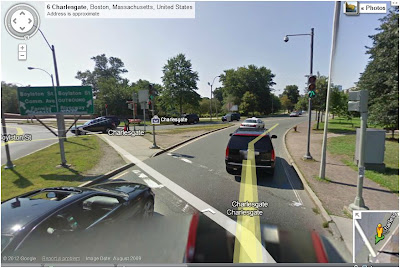
| The Bowker Overpass @ Bolyston Street. |
Problem at Hand
In this study we will investigate the lack of pedestrian compliance stemming from a long waiting time. I conducted a field study at a reasonable peak hour volume where traffic is at its heaviest with a high volume of pedestrians. The field study was conducted on a weekday in April at 6:30pm where the corresponding temperatures were high 57 degrees with a low of 46 degrees. Since the Bowker Overpass is known for its long waiting time for pedestrians, data was recorded in regards to the cycle length of two intersections and two corresponding crosswalks. The apparent wait time, pedestrian delay and Level of Service were all calculated to gauge the noncompliance of pedestrians. Ultimately we will discover that the longer the waiting time, the more likely pedestrians are to cross when they feel safe, not necessarily when it is actually safe.
 |
| Bowker Overpass midweek 6:30pm |
Observations at Crosswalk A
 |
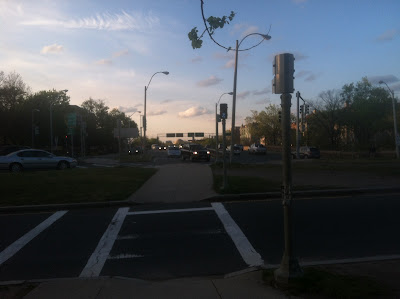
| Two pedestrians waiting to cross |
Pedestrians at Crosswalk A which is the first stage of a three-stage crossing with pork-chop islands and a median refuge island.
| Crosswalk A | ||||
| Motorist Cycle | ||||
| Trial 1 (s) | Trial 2 (s) | Trial 3 (s) | Average (s) | |
| Start of red | 0 | 0 | 0 | 0 |
| Start of green | 43 | 45 | 41 | 43 |
| Start of yellow | 108 | 105 | 103 | 105 |
| Cycle Length | 110 | 112 | 115 | 112 |
| Crosswalk Cycle | ||||
| Trial 1 (s) | Trial 2 (s) | Trial 3 (s) | Average (s) | |
| Start of 'W' | 0 | 0 | 0 | 0 |
| Start of 'FDW' | 15 | 10 | 13 | 13 |
| Start of 'DW' | 20 | 16 | 17 | 18 |
| Length of 'W' | 15 | 10 | 13 | 13 |
| Legnth of 'r' | 97 | 102 | 99 | 100 |
| Average delay | 42 | 47 | 44 | 44 |
| Apparent Excess time | 23 | 22 | 26 | 24 |
| Maximum Delay (r) | 97 | 102 | 99 | 100 |
| LOS | E | E | E | E |
*Three trials were taken to increase the accuracy of results
Start of 'W'= Start of Walk signal for crosswalk
Start of 'FDW' = Start of Flashing Don't Walk for crosswalk (ped clearance)
Start of 'DW' = Start of Don't Walk for crosswalk
'r' = Red time for crosswalk = Cycle Length- 'W'
d = Average delay for pedestrians = (r^2/2*Cycle Length)
Apparent Excess time = Start of green - Start of 'DW'
*Apparent Excess time is the time pedestrians see the don't walk signal, although the green light for vehicles has not stared. Therefore this is their relative wait time for pedestrians.
Interpretation of Results
There are two important values to take note of that greatly influence the level of compliance of pedestrians, the Apparent Excess time (wait time), and the Level of Service (LOS) The Apparent Excess time is the time that pedestrians are given the don't walk signal, in yet the corresponding traffic has not started. In a pedestrians eyes, this can be very frustrating and they will most likely cross when they feel it is safe. Hence, the compliance is very low. Next when we look at the LOS, we note that for each of the trials, the LOS for pedestrians is E, which means that the likely hood of pedestrian compliance is high.
If we look at the chart below provided from the Highway Capacity Manual, the LOS is directly correlated to the average delay for pedestrians. Clearly having a LOS of E influences a high likelihood of noncompliance, which can give pedestrians a false sense of security when crossing which can be very dangerous.
| EXHIBIT 18-9. LOS CRITERIA FOR PEDESTRIANS AT SIGNALIZED INTERSECTIONS | ||
| LOS | Average ped delay | Likelihood of Noncompliance |
| A | "<" 10 | Low |
| B | ≥ 10-20 | |
| C | ">" 20-30 | Moderate |
| D | ">" 30-40 | |
| E | ">" 40-60 | High |
| F | ">" 60 | Very High |
From this scenario at this intersection it is very obvious that a long waiting time corresponds directly to the likelihood of pedestrian noncompliance.
Observations at Crosswalk B
Pedestrians at Crosswalk B which is the first stage of a three-stage crossing with pork-chop islands and a median refuge island.
 |
| Crosswalk B perpendicular to corresponding traffic |
| ||||||||||||||||||||||||||||||||||||||||||||||||||||||||||||||||||||||||||||||||||||||||||||||
*Three trials were taken to increase the accuracy of results
Start of 'W'= Start of Walk signal for crosswalk
Start of 'FDW' = Start of Flashing Don't Walk for crosswalk (ped clearance)
Start of 'DW' = Start of Don't Walk for crosswalk
'r' = Red time for crosswalk = Cycle Length- 'W'
d = Average delay for pedestrians = (r^2/2*Cycle Length)
Apparent Excess time = Start of green - Start of 'DW'
*Apparent Excess time is the time pedestrians see the don't walk signal, although the green light for vehicles has not stared. Therefore this is their relative wait time for pedestrians.
Interpretation of Results
Once again we pay attention to two important values that greatly influence the level of compliance of pedestrians, the Apparent Excess time (wait time), and the Level of Service (LOS) The Apparent Excess time is the time that pedestrians are given the don't walk signal, in yet the corresponding traffic has not started. For Crosswalk B, the compliance is a lot higher than that of Crosswalk A. The wait time is a lot less influencing a higher LOS at an average of B. This means that the pedestrian compliance is moderate. Although the pedestrian compliance is moderate, pedestrians will still cross when they feel it is safe, when in actuality it may not be.
Suggested modifications to Bowker Overpass
To increase pedestrian safety and reduce the long waiting time, it is important to have a shorter red via a shorter cycle. A shorter cycle will mean that pedestrians are waiting for a lesser amount of time and will more likely comply to the signals they are given, rather than walk when they feel safe. another measure is to simply increase the walk time for pedestrians. The pedestrian clearance does not require a lot of time because of the distance of the cross walk (pedestrain clearance = distance/ped speed). In this case, pedestrians should have more time to walk, not worrying about making it across safely.
The video above shows the noncompliance of two pedestrians crossing when the crosswalk signal is clearly red. They miss the traffic by a few split seconds. In this scenario, noncompliance can be dangerous when pedestrians have a false sense of security.
Conclusion
In metropolitan areas where streets that are multipurpose and empty out into residential areas just as much as it does into highways find a difficult time accommodating to the wide spectrum of users. Motorist have an overwhelming influence on the division of priority although pedestrians deserve a high priority as well. Pedestrian safety is significant in these areas because of the high volume of cars with high speeds. Having a low Level of Service influences a low level of compliance, which can in fact be very dangerous. The Bowker Overpass has a very long waiting time for pedestrians making pedestrian compliance very unlikely in most cases. Further provision must be taken to increase pedestrian compliance.
References for Additional Information
Intersection of Bolyston and Bowker Street Overpass – By Gracie Lin
Friends of the Charlesgate – Modifications for the Bowker Overpass
Highway Capacity Manual
-Samantha Kendrick

No comments:
Post a Comment